
A renewable energy project can have excellent wind or solar resource, a strong offtake agreement, and still underperform its financial model.
Two of the most consistent culprits are Marginal Loss Factors and curtailment. For anyone assessing a site, negotiating a connection agreement, or reviewing a project's bankability before financial close, understanding how MLF and curtailment risk interact isn't optional. It's one of the clearest signals of whether a project's revenue projections will hold up in practice.
What Is a Marginal Loss Factor (MLF)?
A Marginal Loss Factor (MLF) is AEMO's annual calculation of the electrical losses between a generator's connection point and its regional reference node. Every generator, load, and storage connection point in the NEM is assigned an MLF each financial year.
An MLF below 1.0 means a generator receives less than the full regional spot price for the electricity it exports. An MLF of 0.90, for example, means the generator is paid 90 cents for every dollar of value at the regional reference node. An MLF above 1.0 means the opposite: the generator is effectively rewarded for its location.
MLFs are driven by a mix of factors:
- How far a connection point sits from the regional reference node electrically
- How much other generation is exporting from the same part of the network
This second factor is why MLF has become such a pressing issue in recent years. It isn't simply about distance. It's about congestion.
What Is Curtailment and Why Does It Happen?
Curtailment is when a generator is instructed, or economically incentivised, to reduce its output below what it could otherwise produce.
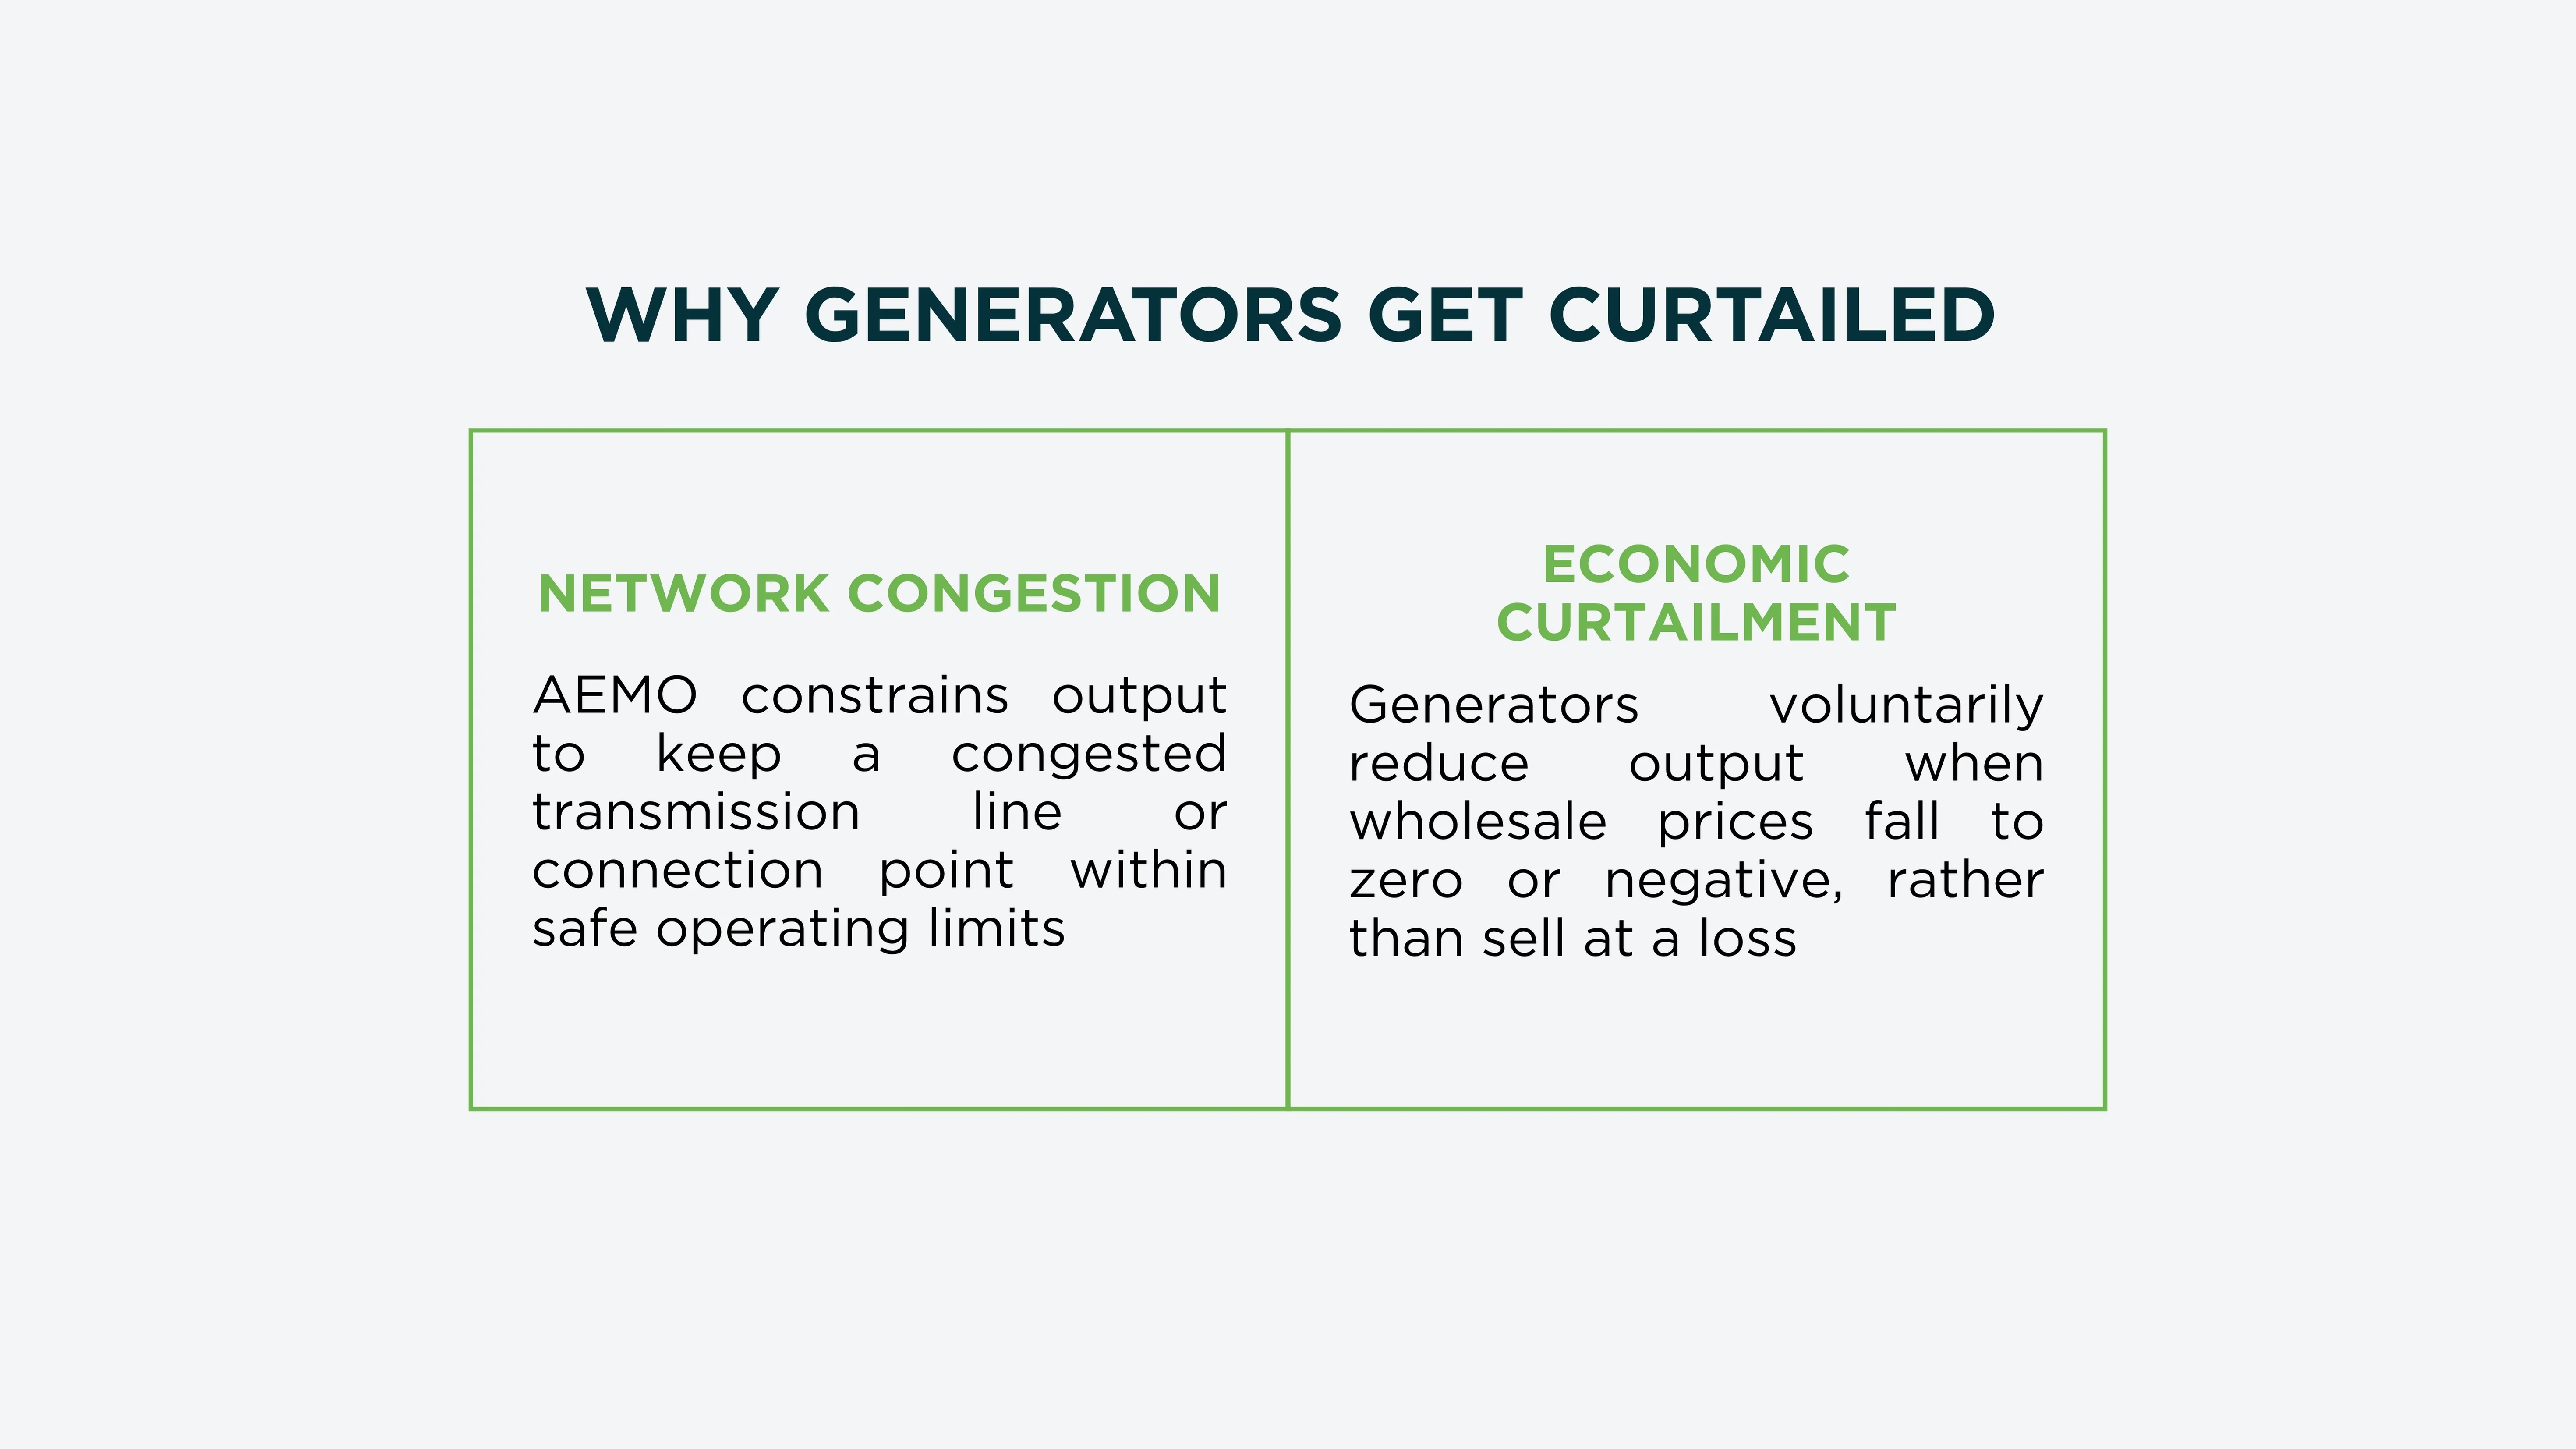
In the NEM, this typically happens for one of two reasons.
- Network Congestion: When a transmission line or connection point reaches its capacity limit, AEMO may need to constrain generation in that area to keep the network within safe operating limits. Areas with a high concentration of new wind and solar projects, often the same regions attracting renewable investment because of strong resource, are the most exposed to this kind of constraint.
- Economic Curtailment: When wholesale prices fall to zero or negative, often during periods of high renewable output and low demand, a generator may choose to reduce output rather than sell electricity at a loss. This has become increasingly common as more variable renewable generation enters the grid.
Either way, the effect on a project is the same: expected output that never gets converted into revenue.
How Are MLF and Curtailment Risk Interconnected?
MLF and curtailment aren't separate, unrelated risks sitting side by side in a project's risk register. They're driven by the same underlying condition, and they compound each other in ways that matter enormously for project economics.
- The same congestion drives both. A part of the network with a high concentration of generation exporting simultaneously tends to produce both a lower MLF and a higher curtailment risk. The mechanism is different, MLF reflects electrical losses, curtailment reflects network capacity limits, but the root cause is often the same: too much generation trying to export through the same constrained part of the network.
- Both risks are self-reinforcing in popular renewable zones. Areas with excellent wind or solar resource attract clusters of new projects. As more generation connects in the same region, both the local MLF and the curtailment risk tend to deteriorate further.
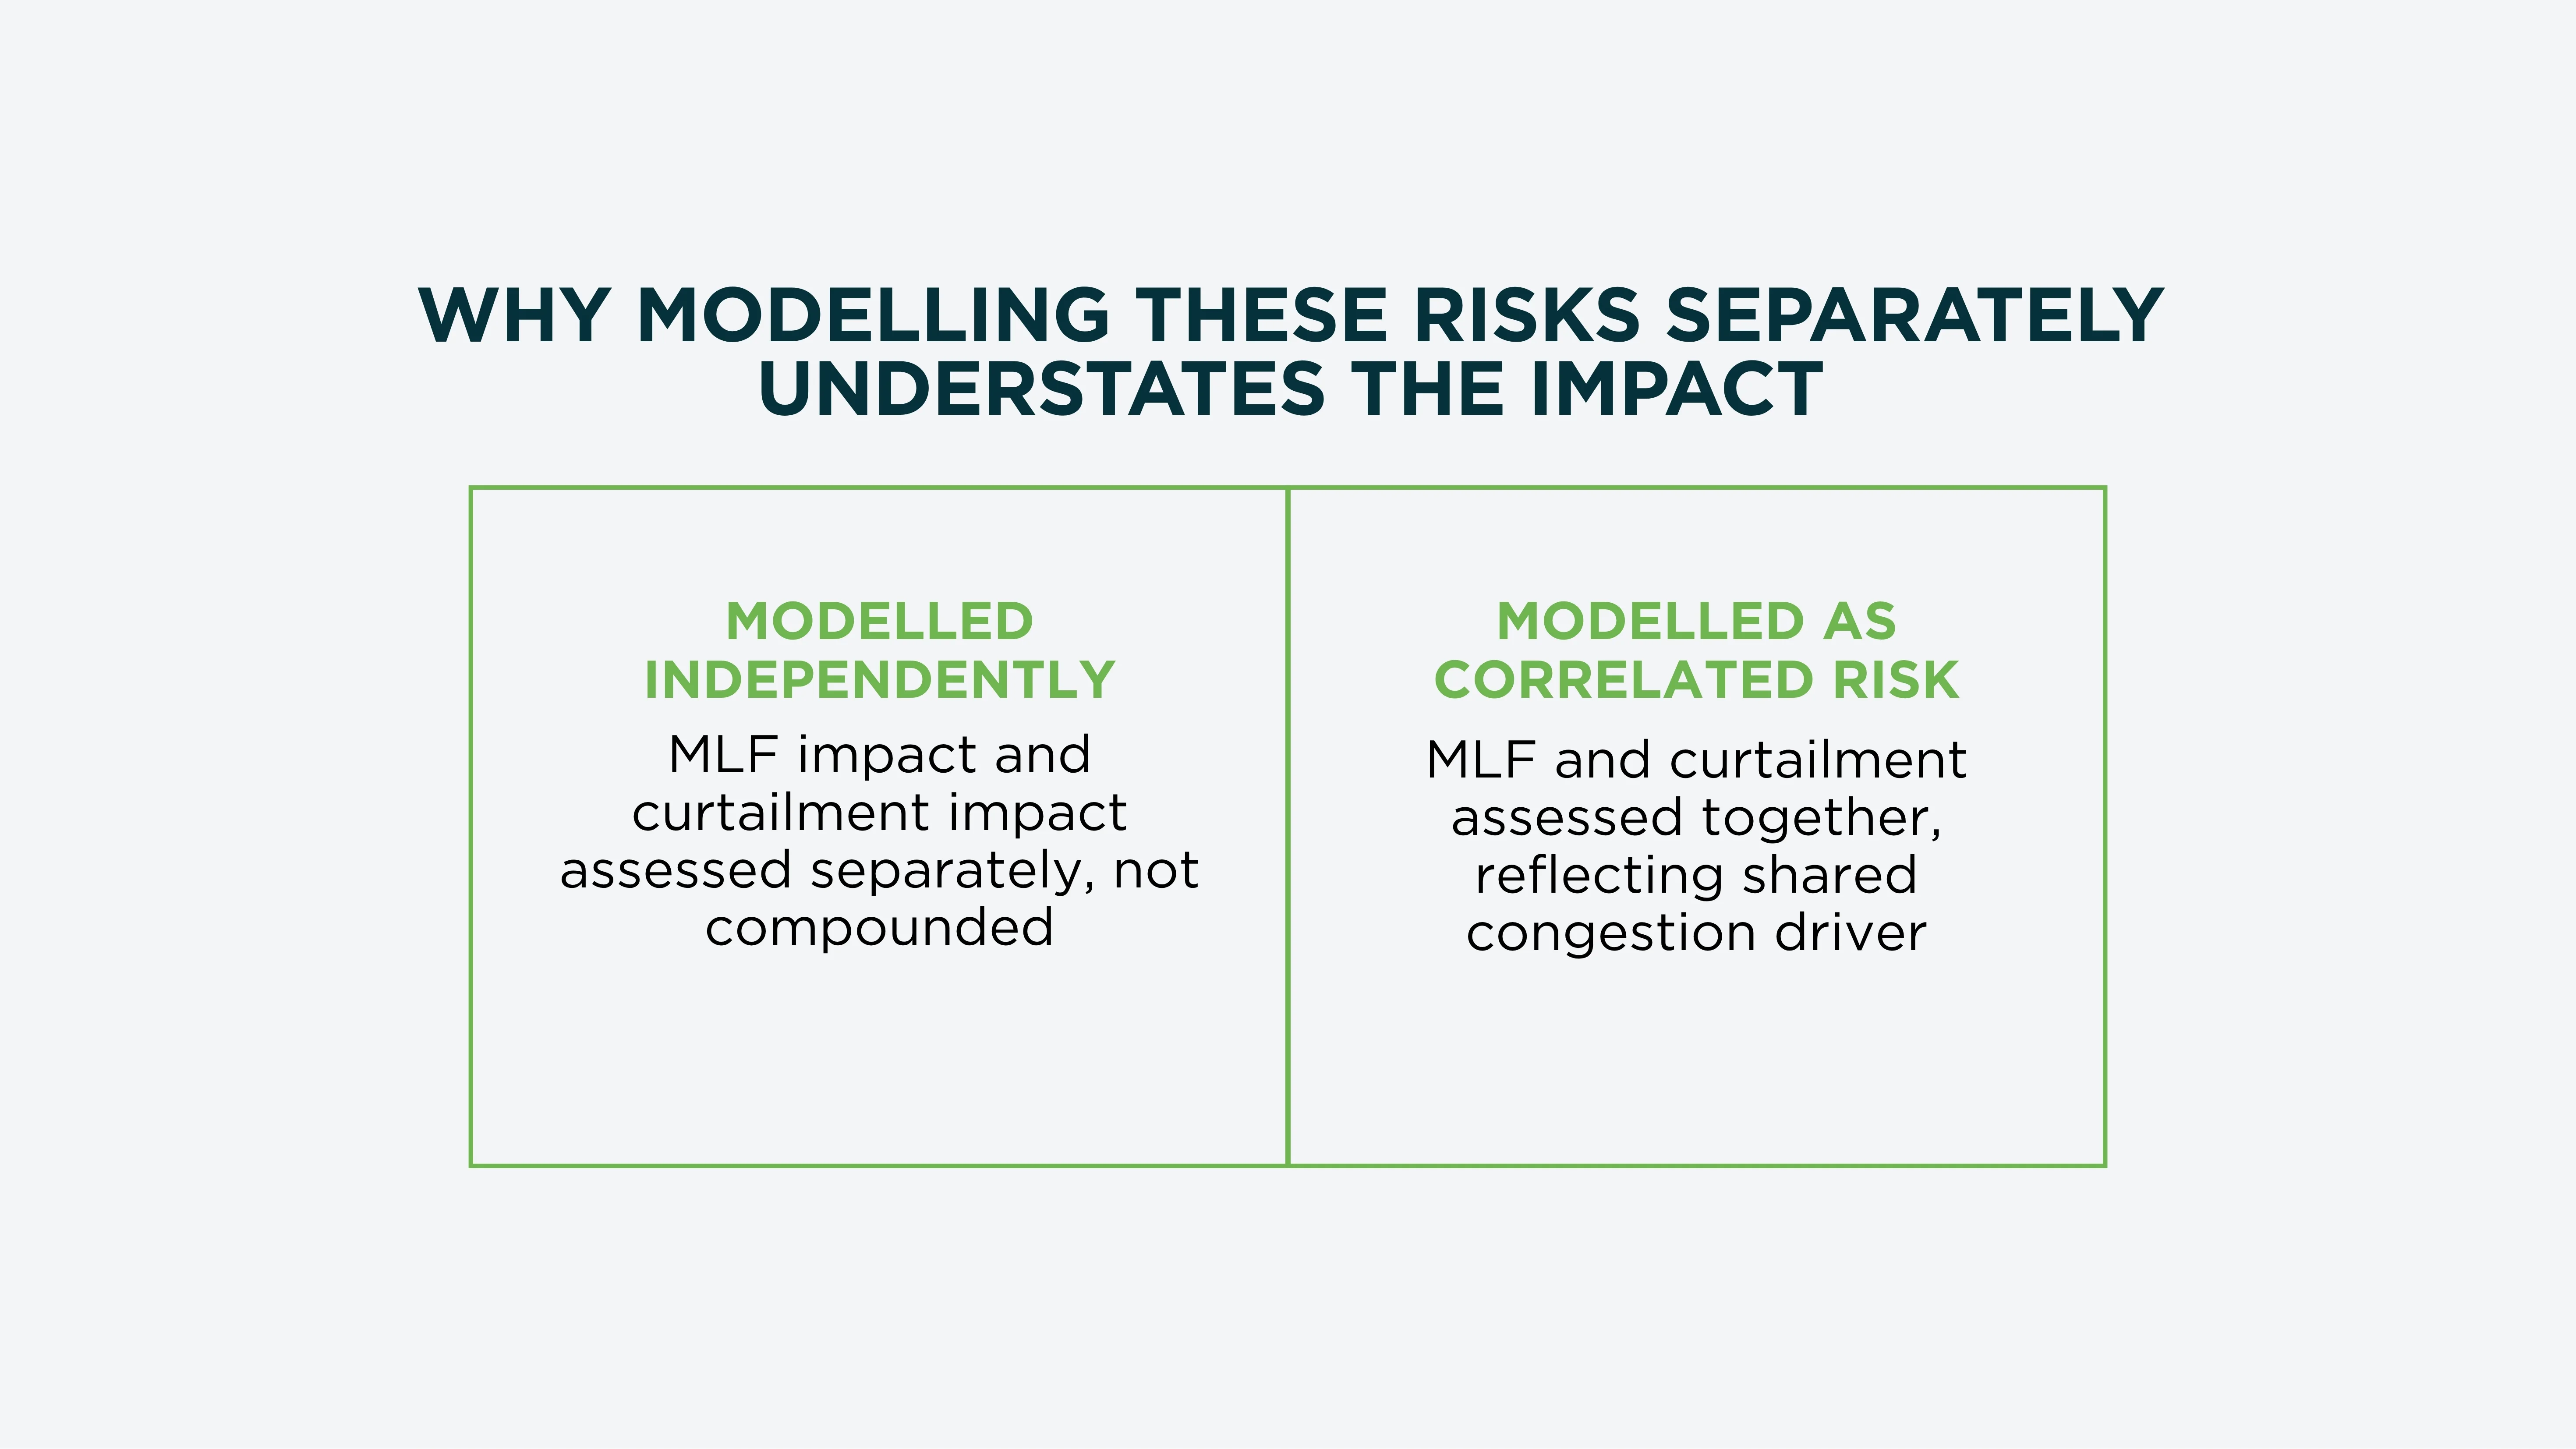
- They create a double revenue reduction. A generator facing both a declining MLF and rising curtailment isn't just losing revenue from two separate sources. It's losing revenue on the reduced volume of electricity it can actually export, at a reduced price for every unit it does export. Modelling these risks independently, rather than as a combined, correlated exposure, consistently understates the real financial impact.
- Both are locational and can change year to year. Unlike a fixed technical constraint, both MLF and curtailment exposure are reassessed regularly and can shift meaningfully from one year to the next as new generation connects nearby. A site with a strong MLF and low curtailment today isn't guaranteed to hold that position for the life of the project.
Why Understanding Both Matters at the Decision-Making Stage
For developers and investors evaluating a site, negotiating a connection agreement, or preparing a project for financial close, MLF and curtailment risk belong in the earliest stages of site selection and financial modelling, for a few clear reasons.
- They directly affect bankability. Lenders and equity investors increasingly scrutinise MLF and curtailment assumptions as closely as resource assessments. A project with an optimistic capacity factor but an unrealistic MLF and curtailment forecast can struggle to reach financial close, or may only do so at a higher cost of capital.
- They affect competitive dispatch position, not just settlement price. AEMO dispatches generation against MLF-adjusted bid prices. A generator with a low MLF is at a structural disadvantage in the bid stack compared to a generator with a favourable MLF at a less congested location, independent of the underlying spot price.
- Site selection decisions are cheaper to change before financial close. Once a project has secured land, permits, and a grid connection agreement at a specific location, the option to relocate to a less congested part of the network effectively disappears. The window to properly weigh MLF and curtailment risk against a site's resource quality is early, not after construction has begun.
- Revenue forecasts built on today’s MLF can be wrong within the year. Relying on a single year's published MLF as a long-term revenue assumption is a common and costly modelling mistake.
How Are MLF and Curtailment Risk Assessed Before Committing to a Site?
- Review historical MLF trends for the specific connection point. MLF volatility varies significantly even within the same state, so a broad regional average tells you far less than the specific connection point's own multi-year trend.
- Model MLF and curtailment as correlated variables. Given how closely linked they are in congested areas, treating them as separate, uncorrelated risks in a financial model consistently understates the combined downside case.
- Assess the pipeline of other projects proposed nearby. A site's current MLF and curtailment profile reflects existing generation. A wave of new projects proposed in the same area is a leading indicator that both risks may deteriorate over the project's life.
- Commission a proper technical and market risk assessment. Understanding how a specific connection point behaves under different network conditions requires detailed technical modelling, not a simple extrapolation of last year's published figures.
- Stress-test the financial model against a realistic downside scenario. A credible financial model should test how returns hold up under a plausible worsening scenario.
Assess MLF and Curtailment Risk with ElectraGlobe
Understanding how MLF and curtailment risk will actually behave at a specific connection point requires more than reviewing a published table. It requires detailed grid connection and power system analysis grounded in how the local network actually operates, and how it's likely to change as more generation connects nearby.
For developers and investors evaluating site selection or preparing a project for financial close, ElectraGlobe's team supports:
- Grid connection studies, a key driver of both MLF and curtailment exposure
- Power system studies to understand how a proposed connection point behaves under real network conditions, not just historical averages
- AEMO Generator Performance Standard (GPS) applications, ensuring a project's technical position is well established
If you're evaluating a site or preparing a project for financial close, ElectraGlobe's engineering team can help you understand the real MLF and curtailment exposure behind the numbers, before it becomes a problem in your financial model.
Get in touch with ElectraGlobe to start assessing your project's risk profile.
FAQ
Can a project's MLF change after it's already operating?
Yes. AEMO recalculates MLFs annually for every connection point in the NEM, and they can move significantly from year to year, particularly in congested areas where new generation continues to connect. A project's MLF at financial close is not guaranteed to hold for the life of the asset, which is why long-term revenue models need to account for realistic MLF volatility rather than a single static assumption.
Does a high-quality wind or solar resource offset poor MLF and curtailment risk?
Not necessarily. A site with excellent resource but poor MLF and curtailment exposure can significantly underperform a site with more moderate resource but a stronger network position, once the combined revenue impact is properly modelled. The regions with the best renewable resource in Australia are often the same regions facing the highest congestion, which is exactly why this trade-off needs to be assessed explicitly rather than assumed away.
How is curtailment risk different from a network outage?
An outage is an unplanned interruption to network availability, typically caused by equipment failure or extreme weather. Curtailment is a deliberate reduction in a generator's output, either instructed by AEMO to manage network congestion, or chosen by the generator itself in response to low or negative wholesale prices. Curtailment is generally more predictable and more closely tied to how much other generation is connected in the same part of the network.